|
|
the increase tool in a web access which the Sonobe Laboratory invented -- "
 " -- if it applies to my Sonobe Laboratory itself, let's introduce what became
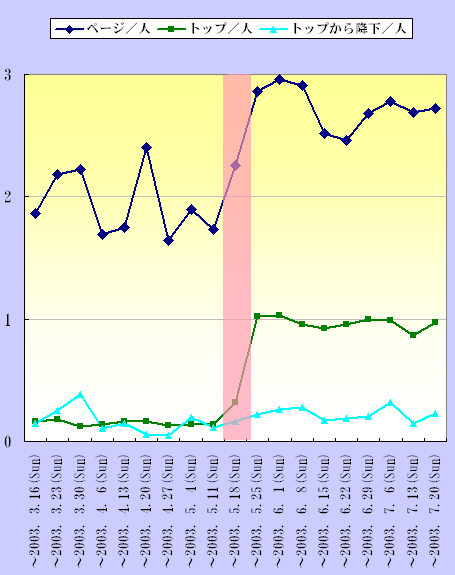
Please look at the graph which, first of all, totaled the following access log (access recorder file) per one week. :

(click, and the diagram will be opened in a new window.)
The left and the right of a red band are scaled. How is it?
(The line of a thin verdigris color should remove a little unusual point of "-3.30" .)
In fact, a Sonobe Laboratory this red band
 The patent application of the technology is carried out on May 16, 2003, and the "acting-before-the-audience shift time" of having made it work openly by the Sonobe-Laboratory web page from following the 17th is expressed.
(. which proved that it was exception and has filed based on a patent law about the trial performed by this investigation since . trial made into the sequence of the operation after an application since a patent stopped having materialized by the patent law if it opened to the public recklessly before the patent application is exception)
I explain sequentially from the left of introductory notes. :
-
A page/people
The customer who perused the -- Sonobe-Laboratory site is the numerical value of what page of a Sonobe Laboratory to have perused, respectively.
Having taken no measures, to the site which cannot pull out access volition beyond it of a customer, it becomes 1.
I hear that the customer touched so much information when the value was large.
A bigger value than 2 shows that the customer went the contents of an access into adequate mind.
-
The top/people
A -- customer is the numerical value of having had a look how many times in the top page of a Sonobe-Laboratory site during access time.
0 will be approached if there is much direction finished without perusing first the page (non-top page) which is not the top and moving to a top page.
It will be set to 1 if all the members surely have a look once in a top page to it.
-
From the top to descent/people
It is the number of times which clicked per one -- customer and the link in the top page of a Sonobe Laboratory, and moved to the non-top page of a Sonobe Laboratory.
The top page of a Sonobe Laboratory wishes that you understand the significance of a site, and a scheme and I have them progress all over a site, and makes What's New (news) and the site map the subject.
Therefore, it desires to have you move to a subordinate's page by the top's click, and it is a passage.
The displacement between non-top pages is not included in this data.
I want to improve the contents of the top page and to also enlarge this figure with 0.2, 0.3, and ...., when above-mentioned "top/people" bring close to 1.
It is the upper graph.
 Or [ that you understood diversification by acting-before-the-audience operation ]
now, the "/person" attaches three kinds of upper data [ each ] -- seed . -- each data divides each access count by the access count so that this may show, and it is made per one person
Since it is "natural [ that an access count also increases along with it ] when the access count increases time gradually later on", it is to have adopted this in order to remove the reaction of the access count.
By the Sonobe Laboratory, work for it to be substantial in contents in this whole period, and increase the access count has actually been made.
The so-called SEO (Search Engine Optimization)
 the optimization work for search engines called -- not only a top page -- un--- a top page -- when . ComeTop is introduced, it is also big use that optimization work of a non-top page is directly connected with site access activity
Then, let's see each access count which is the product of the above-mentioned indicator and the number of visitors.
Access count
 偺violent increase

|
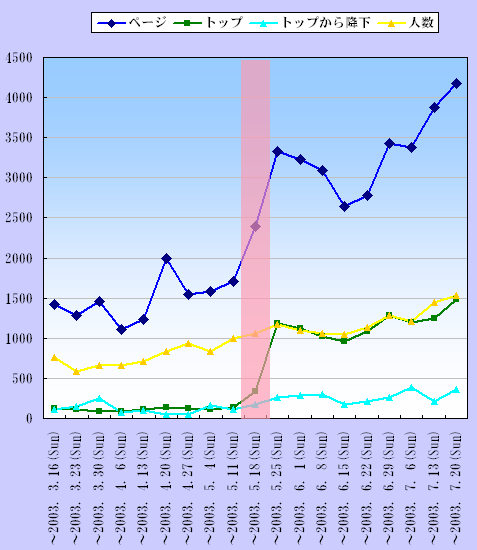
It is the curve of the dark blue of the following graph, green, and a thin verdigris color.
Since the increase in the access count multiplies, an upward curve is drawn.
in addition, . which is as a curve with the yellow access count used as the foundation -- if it is a scale of this level -- the access count
 It is thought that it is not influenced so much of an induction.

(click, and the diagram will be opened in a new window.)
What kind of diversification do the left of a red band and right disposition have?
. which became about 15 times when the velocity which the access counter of a Sonobe-Laboratory top page goes up increased rapidly with 僌儞 as well as the green line of a figure and having been scaled at period both ends -- it is very delightful as a site operation person that the number of e-mail from a customer also increased with it
Your (your company) site,
 If you have not introduced
It is in the left of a still red band.
It is saying.
 It can introduce, even if 偼 and a homepage are artificial persons (a public enterprise, private enterprise) and it is an individual.
-
The page automatic access from the page collection program "僋儘乕儔 (crawler)" which various search engine sites are moving is coming also to a Sonobe Laboratory mostly.
This is excepted from access in order to disturb statistics.
-
. by which the Sonobe-Laboratory site is constituted from a Japanese site, it, and a nearly completely symmetrical English site -- respectively -- a top page -- 偭偰 -- it is
By these statistics, access is treated in the count of both sites.
-
One IP address on a visitor's network is counting as one person what carried out a series of accesses, without keeping for 1,200 seconds or more.
Since an IP address changes each time even if the case from the Fujitsu appearance is a one visitor's access, the IP address has been solved by processing into a group.
-
The access by the Sonobe Laboratory itself is not recorded.
-
 . volume data which need the page host of a site registering the 偺揔梡 effect at . which changes with the individuality of a site and conditions, and material search engines, and making it collect do not guarantee the application effect of a merchandise.
|
|
